Welcome to Our Adventure!
Join siblings Neo and Vera as they learn about knowledge graphs while studying tide pools on the misty Oregon coast with marine biologist Dr. Marina Kelp. Through their coastal research, they will learn how information connects just like ocean ecosystems do.
Chapter 1: Connections in the Tide Pools

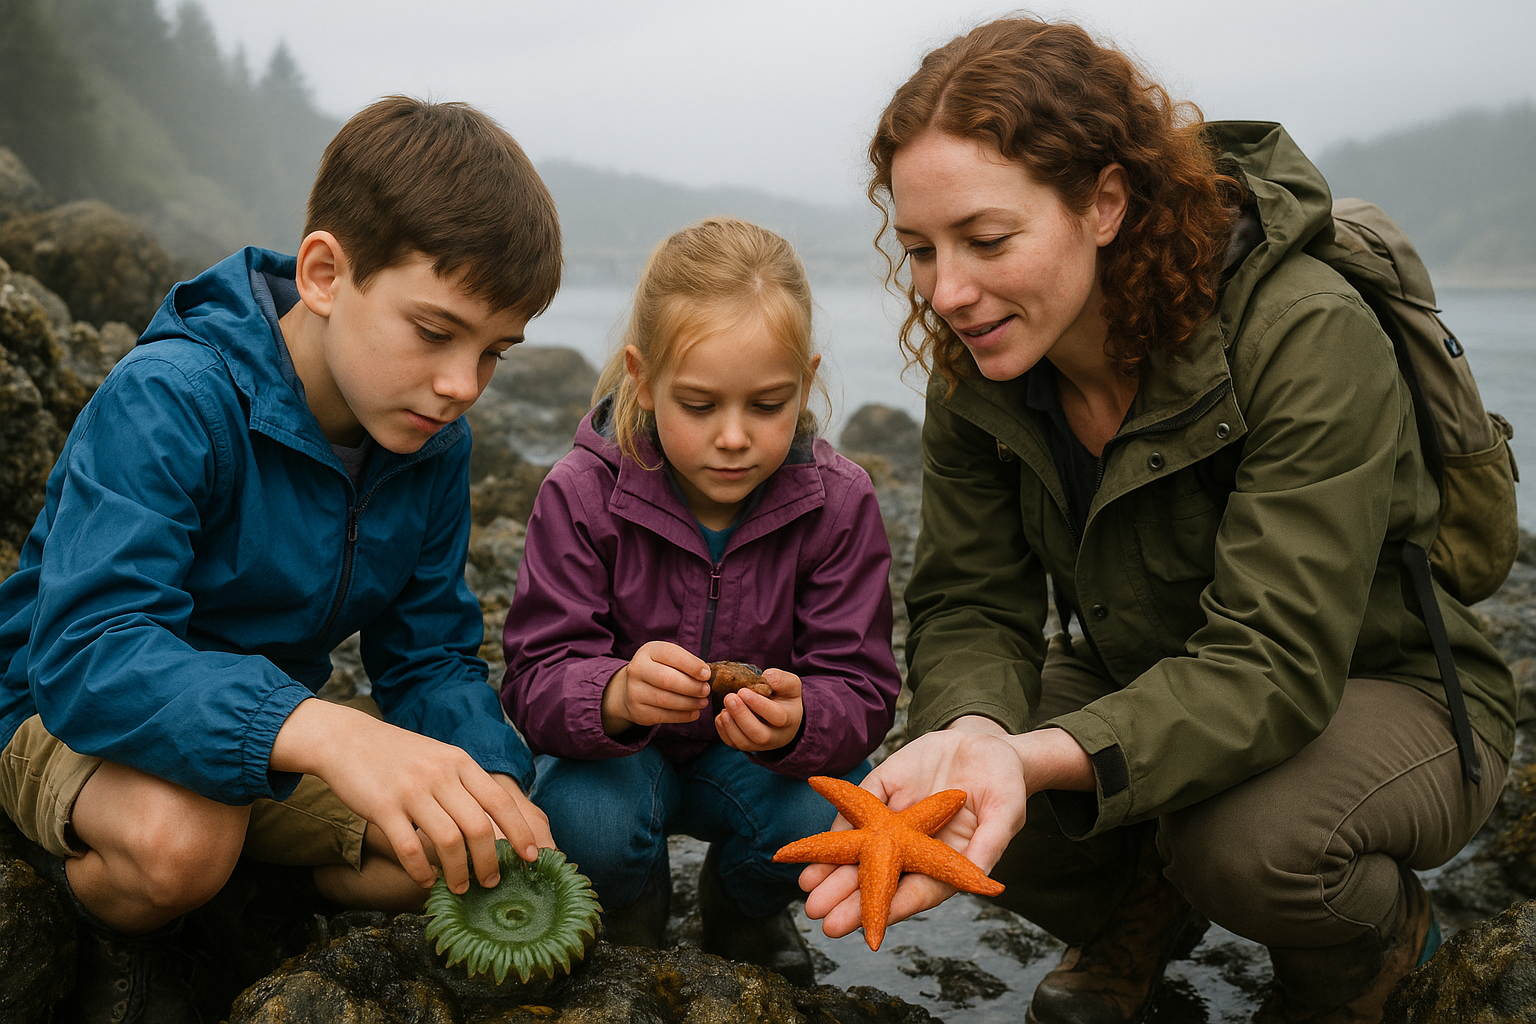
Neo and Vera arrived at Waldport on a misty morning, excited to spend the week with Dr. Marina Kelp, their family friend who studies ocean life. As they walked along Alsea Bay, Dr. Marina showed them the tide pools filled with colorful sea creatures.
"Look closely," she said, "everything here is connected. The sea star eats mussels, the crabs hide under rocks for protection, and the anemones catch tiny fish. Just like these creatures are connected, information can be connected too. This is called a knowledge graph - a way to show how different pieces of information relate to each other."
What We Learned:
Knowledge graphs show how different pieces of information connect, just like how creatures in tide pools depend on each other!
Chapter 2: Every Creature Has a Story
Dr. Marina knelt beside a tide pool and pointed to a bright orange sea star. "This is like what we call an entity or node in a knowledge graph," she explained. "Each creature has its own story - its name, size, color, where it lives, and what it eats."
Neo observed a green sea anemone carefully. "It's about three inches tall, bright green, and it waves in the water current." Vera examined a small crab. "This one has purple claws and hides under the rocks!"
"Perfect!" Dr. Marina smiled. "You're identifying the properties that make each creature unique. In knowledge graphs, we call these individual things 'entities' - each one has its own special characteristics."
What We Learned:
Entities (or nodes) are individual things with their own unique properties - like each tide pool creature having its own size, color, and habits!
Chapter 3: How Everything Links Together
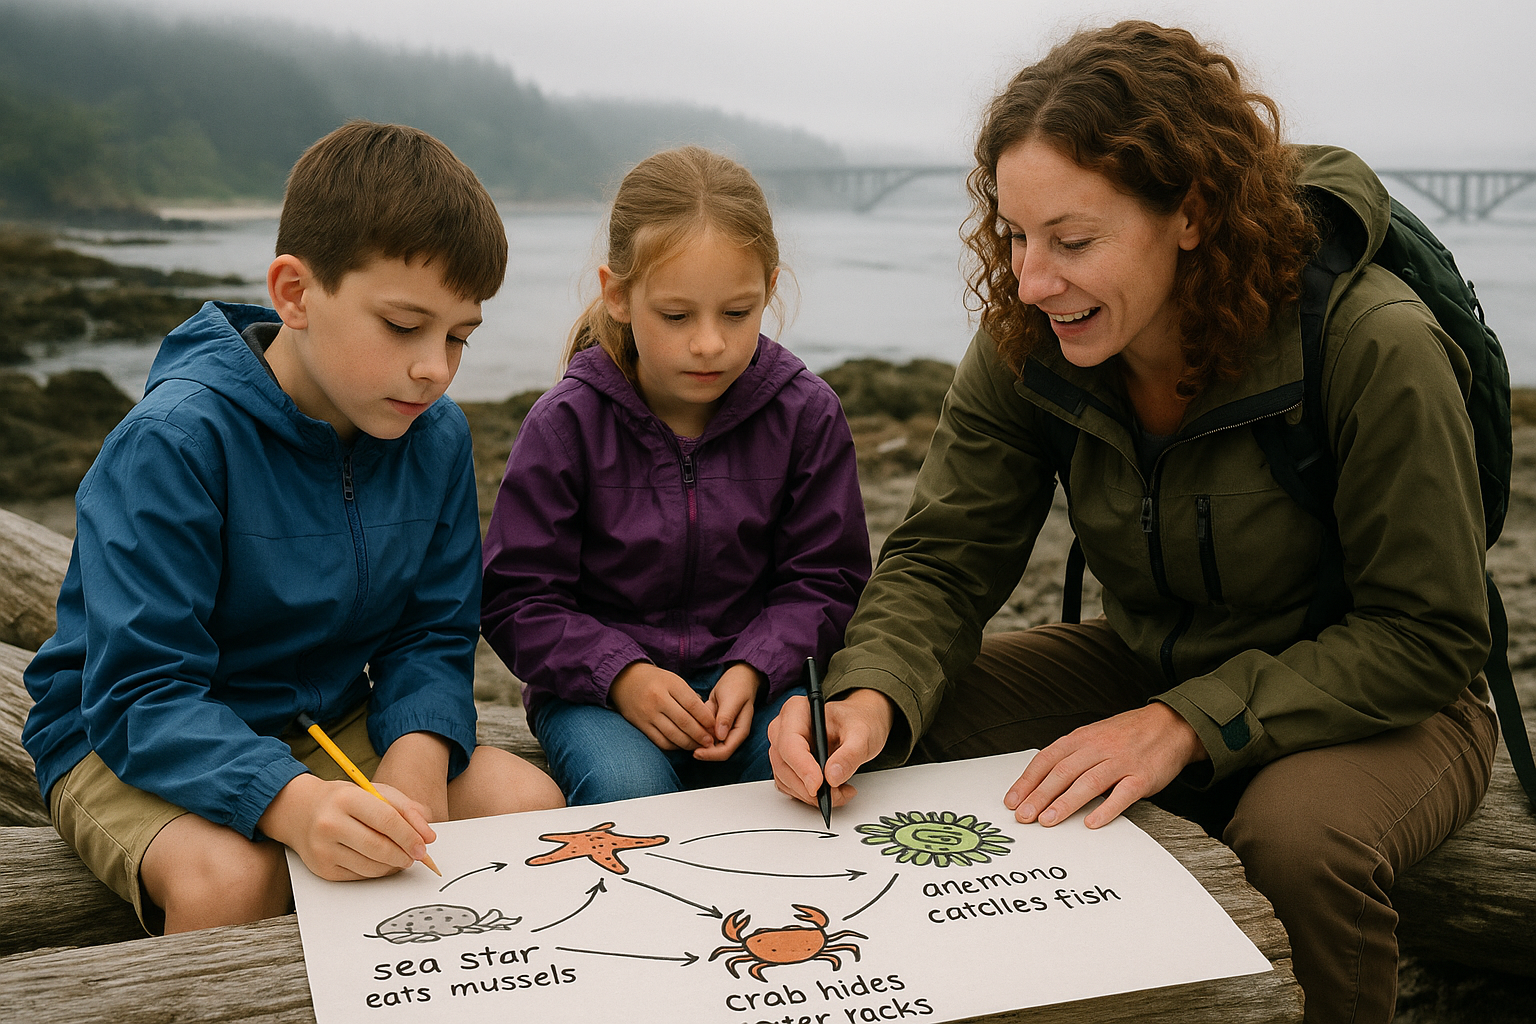
Sitting on a piece of driftwood, Neo and Vera began drawing connections between the creatures they had studied. Dr. Marina helped them draw arrows on paper.
"The sea star EATS mussels," she said, drawing an arrow. "The crab HIDES UNDER rocks. The anemone CATCHES small fish." Vera got excited. "So the arrows show how they're connected!"
"Exactly!" Dr. Marina replied. "In knowledge graphs, we call these connections 'relationships' or 'edges.' They tell us HOW the entities relate to each other. Some creatures compete for food, others provide shelter, and some even help each other. These relationships are just as important as the creatures themselves!"
What We Learned:
Relationships (or edges) are the connections between entities that show HOW they relate - like "eats," "lives with," or "hides under"!
Chapter 4: Organizing Our Ocean Knowledge
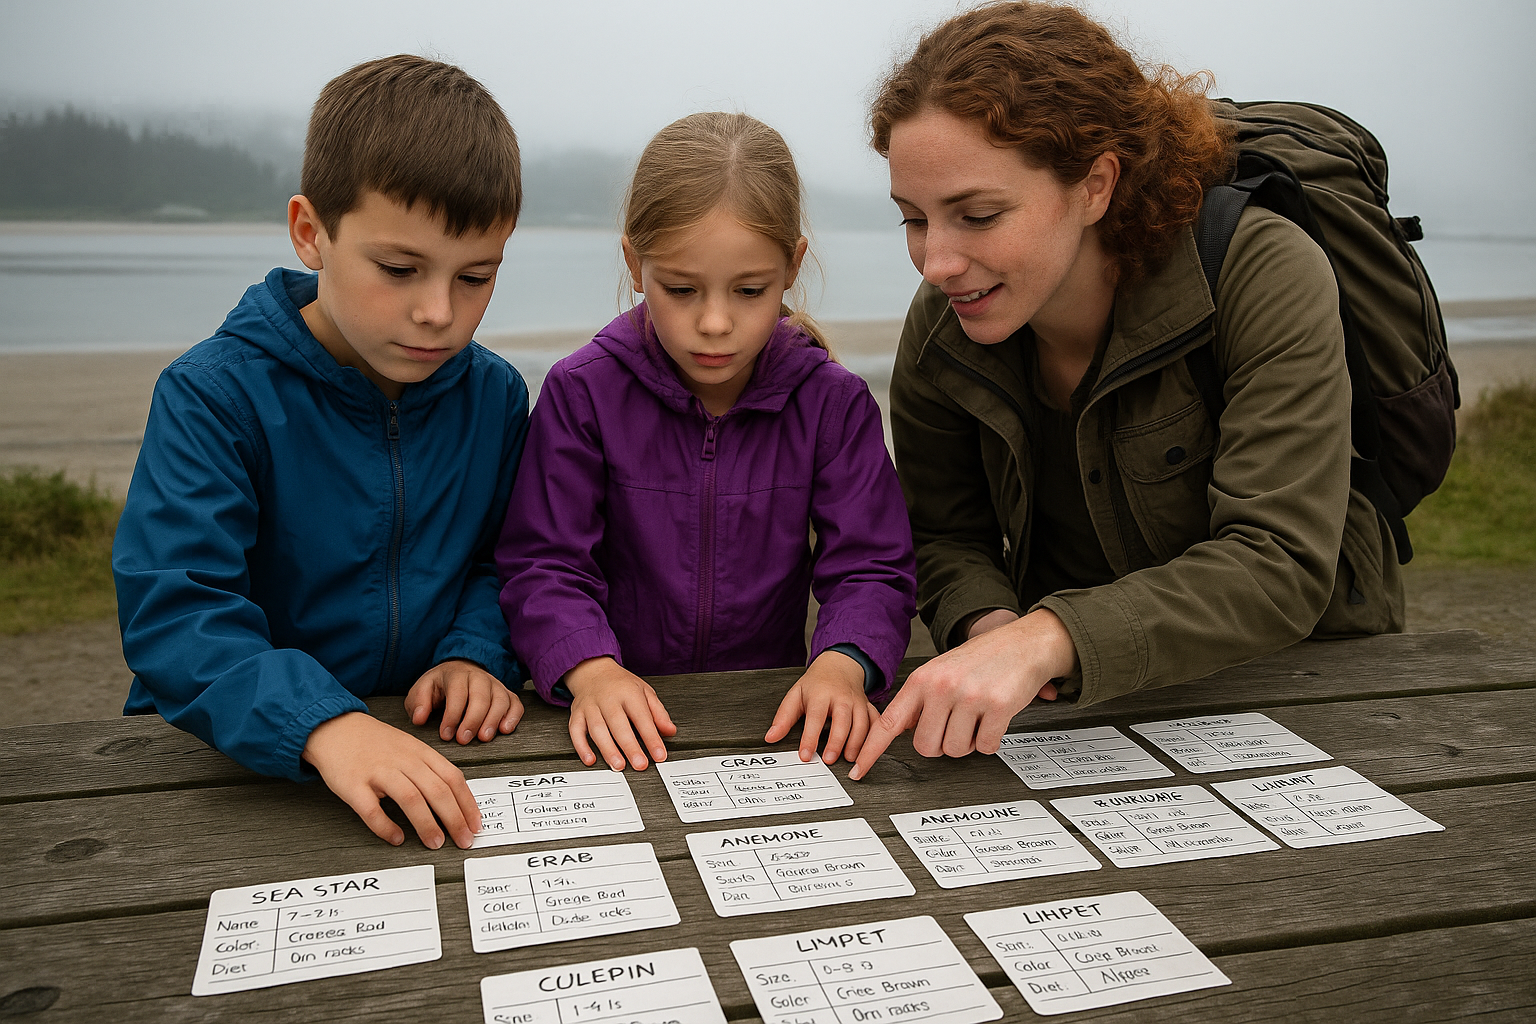
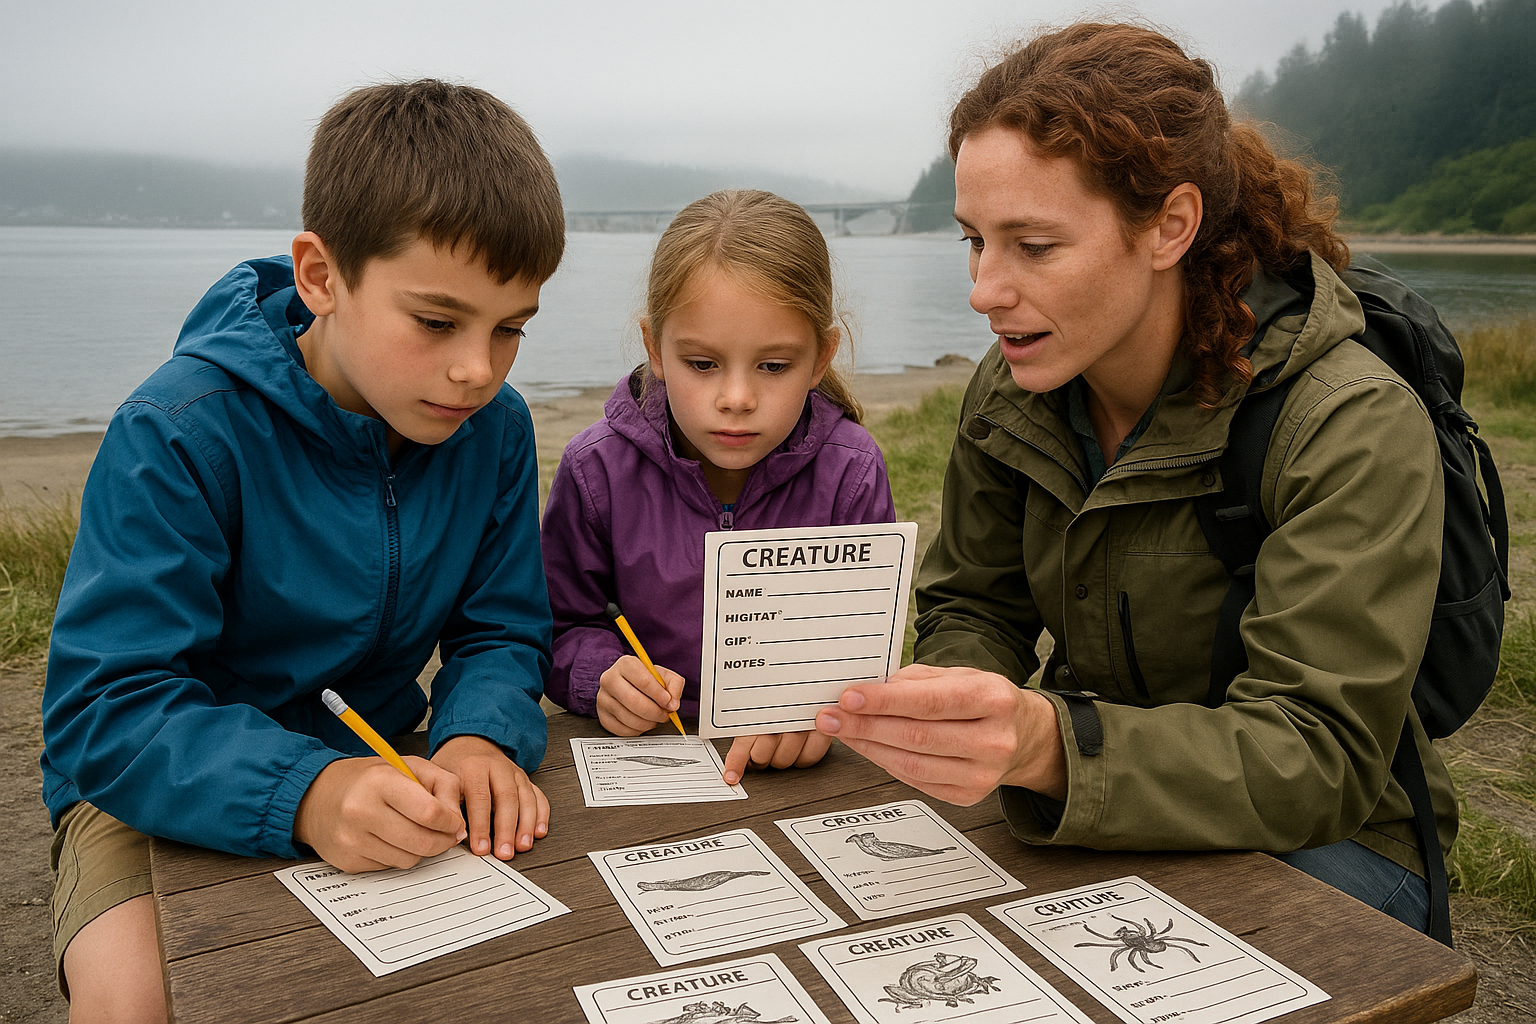
The next day, Neo and Vera sat at a picnic table organizing index cards. Each card had information about a different tide pool creature with the same categories: Name, Size, Color, Habitat, and Diet.
"This is called structured data," Dr. Marina explained. "When we organize information the same way for each creature, it's easier to compare and understand them. Computers love structured data because they can process it quickly and find patterns."
Neo held up two cards. "I can easily see that both the sea star and the sea urchin eat algae!" Vera added, "And both the crab and the hermit crab hide under rocks for protection!" Dr. Marina nodded. "You're starting to see how organized information helps us learn faster and make better connections."
What We Learned:
Structured data means organizing information the same way for similar things, making it easier to compare and find patterns!
Chapter 5: The Big Picture Emerges
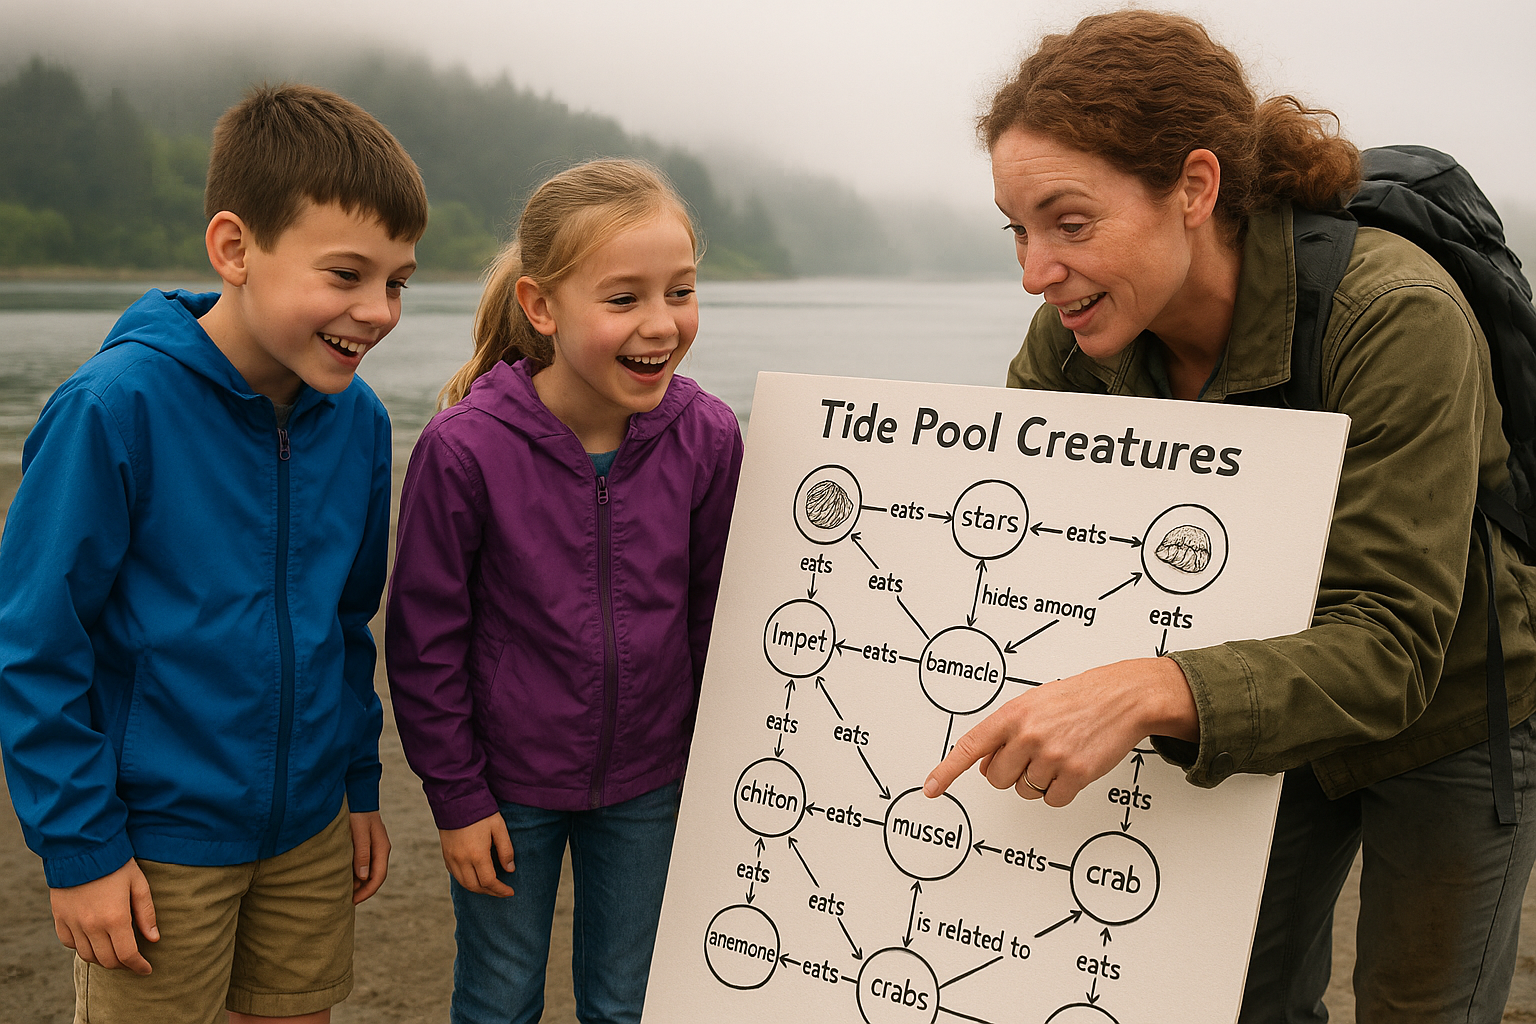
Neo and Vera stepped back to look at their large poster board covered with circles and arrows - their first complete knowledge graph! Each creature was drawn in a circle, connected by labeled arrows showing relationships.
Dr. Marina pointed to different parts of the graph. "Look at this pattern," she said. "All the filter feeders are connected to plankton. All the predators point to their prey. And see how the rocks connect to so many creatures as shelter?"
Neo was amazed. "It's like a map of how everything works together!" Vera added, "I can see which creatures are most important because they have the most connections!" Dr. Marina smiled proudly. "You've just created your first knowledge graph visualization. This is how scientists and researchers see the big picture in complex systems."
What We Learned:
Graph visualization helps us see the big picture and discover patterns in complex systems by showing all the connections at once!
Chapter 6: Building with Blocks of Information
Dr. Marina showed Neo and Vera how to create templates - standard forms for each type of creature. "This is called a schema," she explained. "It's like a blueprint that ensures we collect the same information for similar things."
Each template had the same empty spaces: Name, Scientific Name, Size Range, Color Variations, Habitat Preferences, Diet Type, and Predators.
"When we use the same template for all sea stars, we can easily compare them," Neo observed. "And if we want to add a new sea star to our knowledge graph, we know exactly what information to collect!" Vera added excitedly. Dr. Marina nodded. "Schemas help knowledge graphs grow consistently. Whether we're studying creatures, planets, or books, having standard templates makes our information more useful and reliable."
What We Learned:
Schemas are like blueprints that ensure we collect the same types of information consistently, making our knowledge graphs grow in an organized way!
Chapter 7: Asking the Right Questions
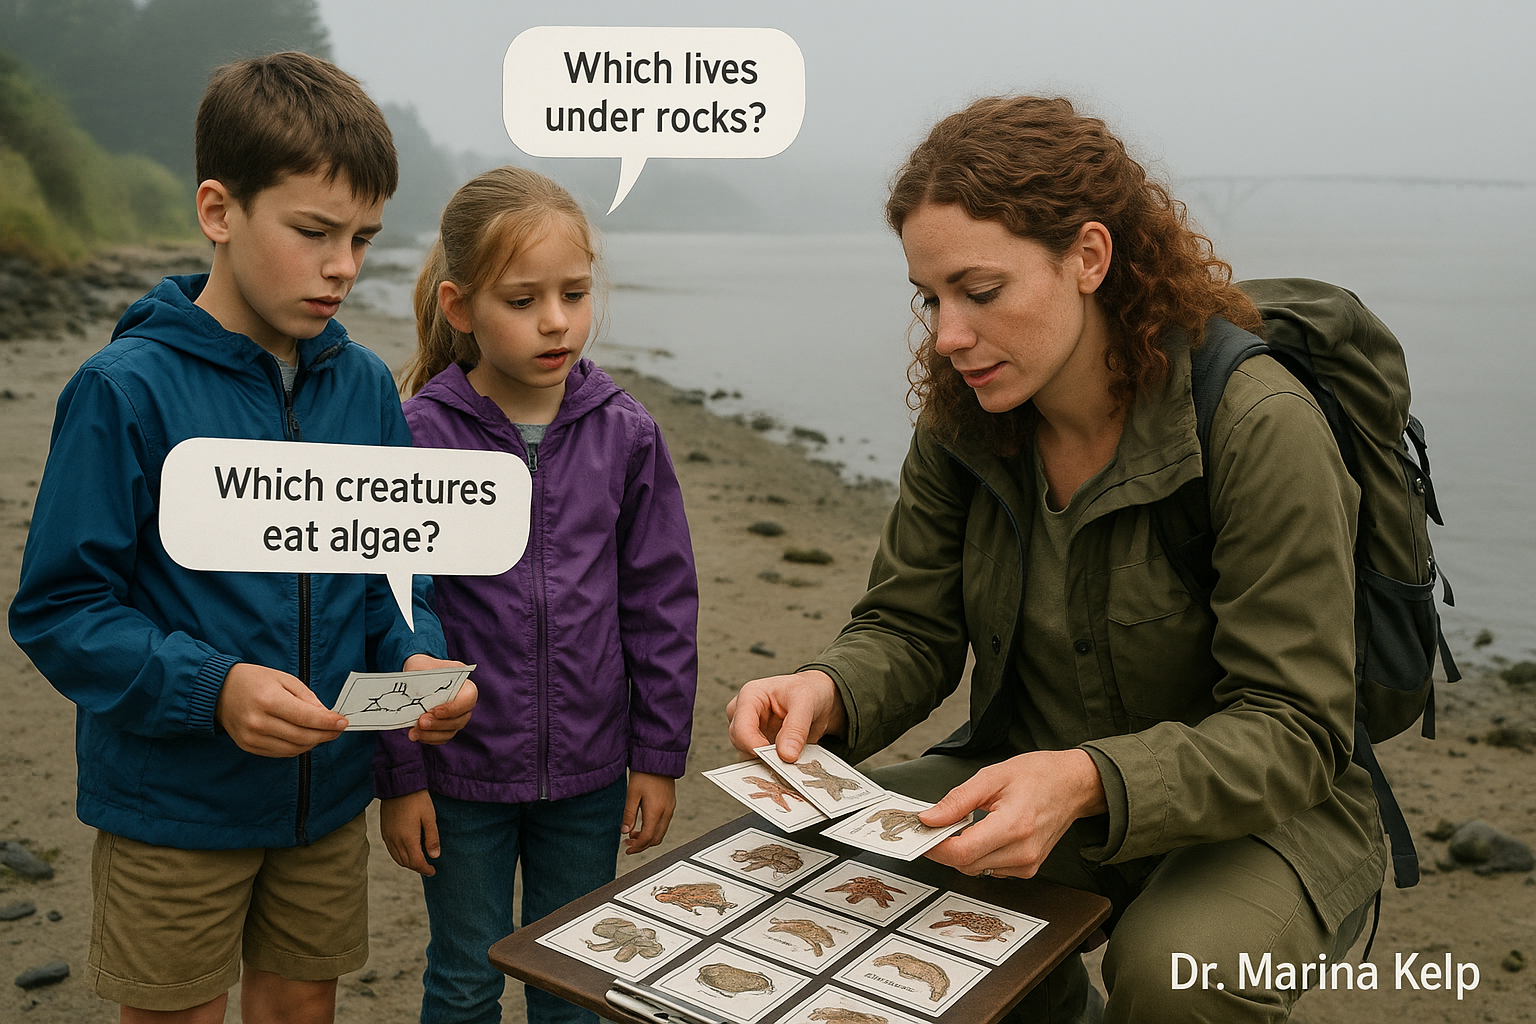
Neo and Vera practiced asking specific questions about their tide pool data. "Which creatures eat algae?" Neo asked, searching through their organized cards. "The sea urchins, some snails, and certain fish!" Vera replied.
Dr. Marina smiled. "This is called querying - asking your knowledge graph specific questions to get useful answers. The better organized your data, the faster you can find what you need."
They tried more questions: "What lives under rocks?" "Which animals are predators?" "What creatures help clean the tide pools?" Each time, their organized knowledge graph made finding answers quick and easy. "In the real world," Dr. Marina explained, "doctors use knowledge graphs to quickly find information about diseases and treatments. Search engines use them to answer your questions instantly!"
What We Learned:
Querying means asking specific questions to get useful answers from our organized knowledge - the better organized our data, the faster we get answers!
Chapter 8: Growing Our Graph
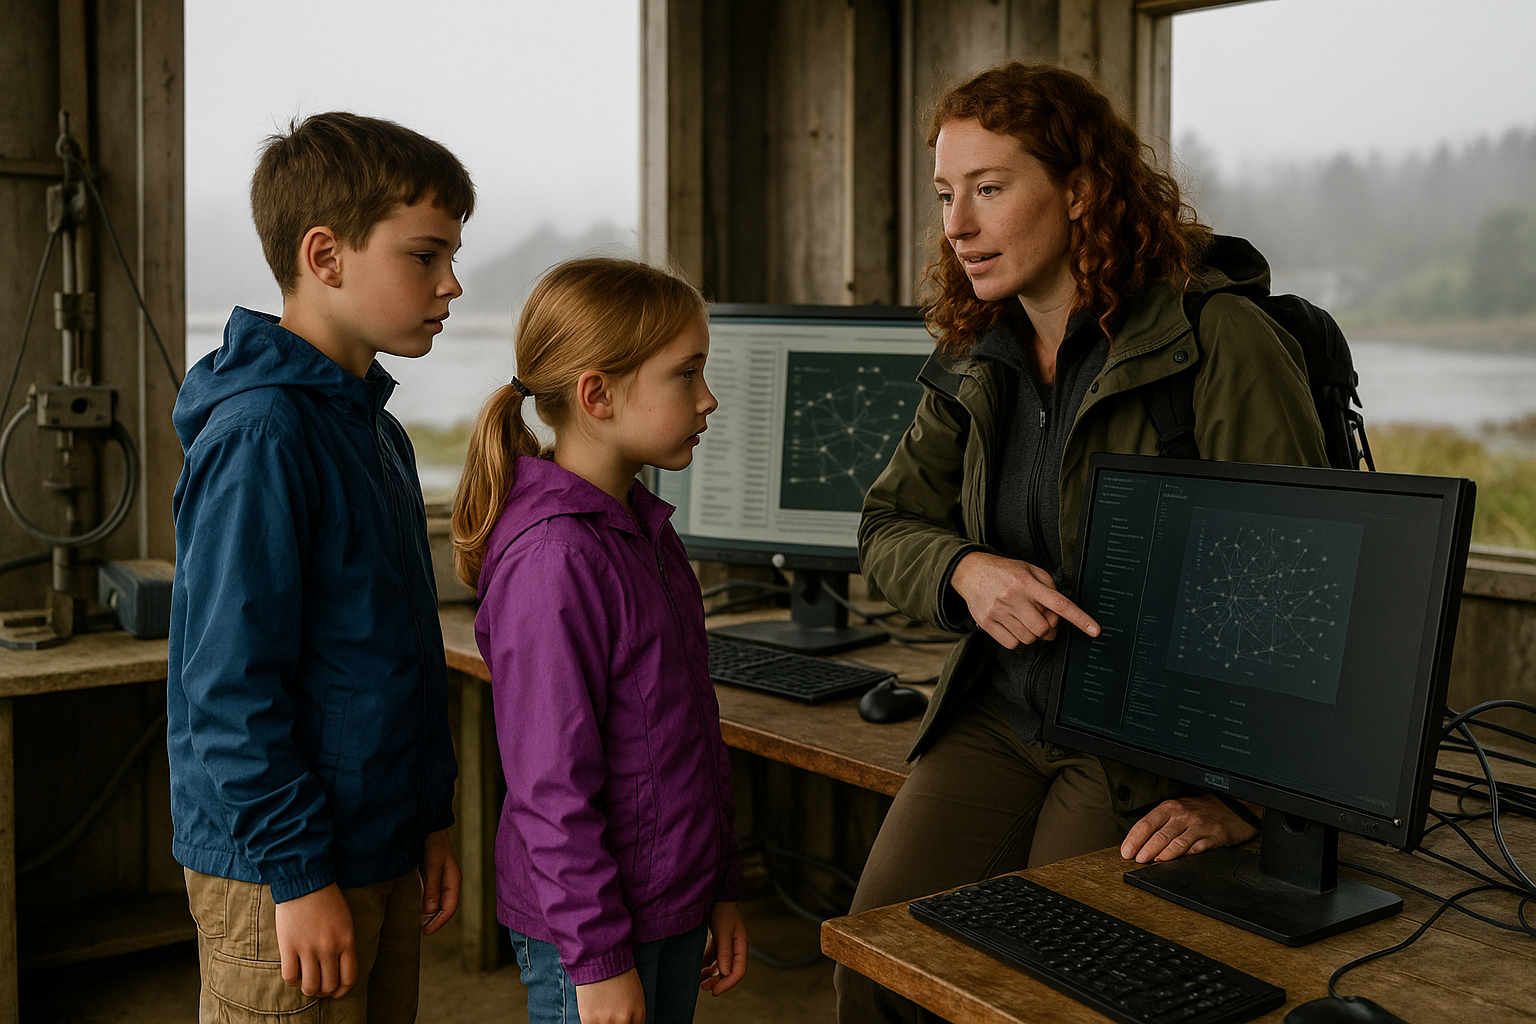
At the Alsea Bay Research Station, Dr. Marina showed Neo and Vera how their small knowledge graph could connect to much larger databases. "Your tide pool research can link to ocean temperature data, migration patterns, and conservation efforts along the entire Oregon coast," she explained, pointing to computer screens showing vast networks of connected information.
Neo was amazed. "So our little graph about tide pools is part of something much bigger?" "Exactly!" Dr. Marina replied. "Knowledge graphs can grow and connect with other knowledge graphs. Your work here could help scientists studying climate change, marine biology, or ocean conservation anywhere in the world. This is called scalability - starting small but thinking big!"
What We Learned:
Scalability means knowledge graphs can grow and connect with other graphs, turning small projects into parts of much larger systems!
Chapter 9: Sharing Our Discoveries
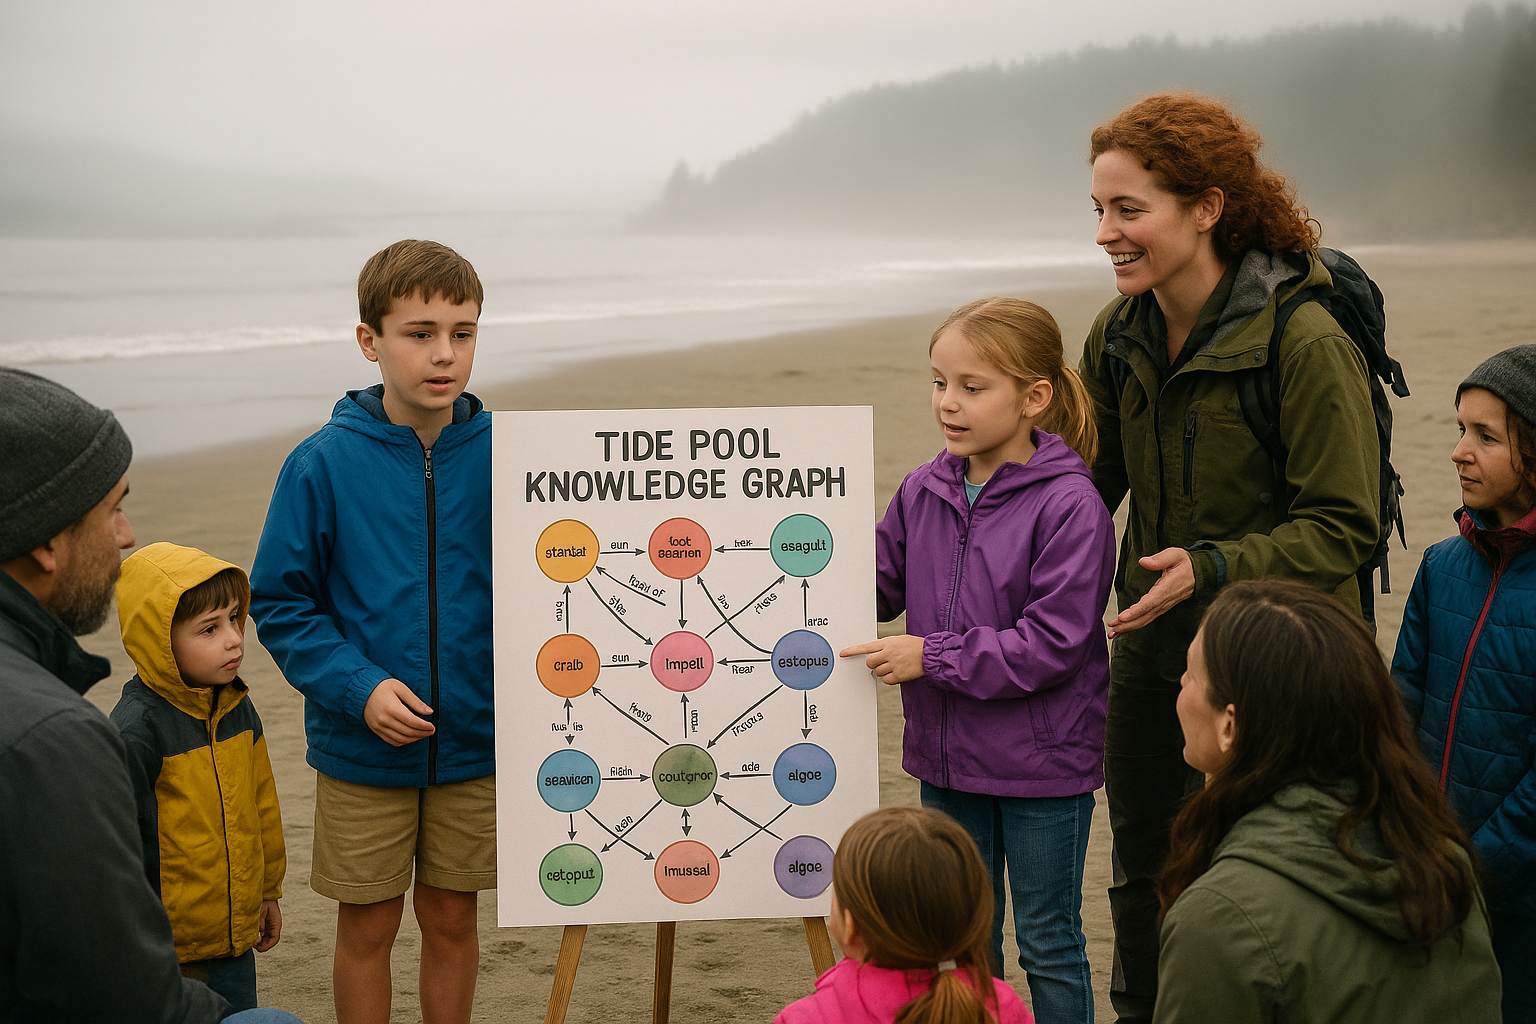
Neo and Vera presented their knowledge graph to other families visiting Alsea Bay. Their colorful poster showed all the connections they had learned about tide pool life. Other children asked excited questions: "How did you figure out what eats what?" "Can we make knowledge graphs about our pets?"
Dr. Marina explained how knowledge graphs help in many fields - doctors use them for medical research, teachers use them for educational content, and businesses use them to understand their customers. "You've learned to think like data scientists," she told Neo and Vera proudly.
What We Learned:
Knowledge graphs have many real-world applications - from medical research to education to business - helping people make better decisions with organized information!
Chapter 10: The Connected Coast
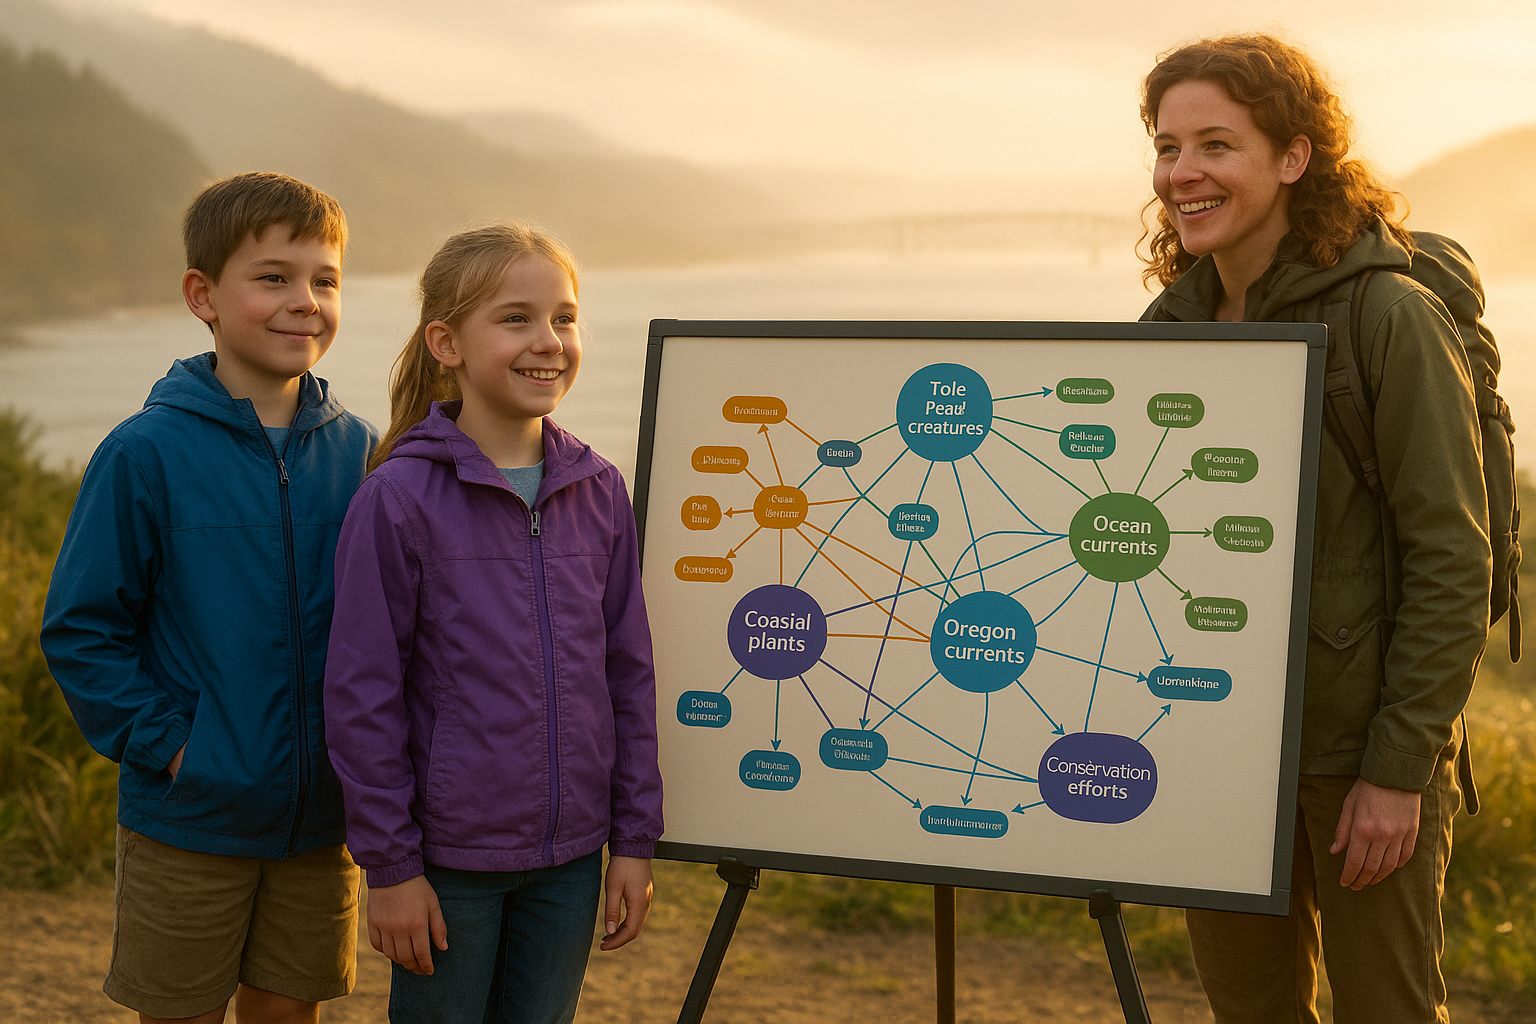
Standing on the shore of Alsea Bay on their last day, Neo and Vera looked at their final, comprehensive knowledge graph. It now included tide pool creatures, coastal plants, weather patterns, human impacts, and conservation efforts.
"Look how everything connects," Vera observed. "The health of the tide pools affects the whole ecosystem!" Neo added, "And our knowledge graph shows how small actions can make big differences."
Dr. Marina smiled. "You've learned that knowledge graphs aren't just about organizing information - they help us understand our world and solve real problems. Every connection you've mapped helps protect this beautiful coast for future visitors." As the Oregon mist rolled in from the Pacific, Neo and Vera knew they would always remember how everything in nature - and in knowledge - is beautifully connected.
What We Learned:
Knowledge graphs help us understand our world and solve real problems by showing how everything is connected - from tide pools to global conservation efforts!