How to Create a Knowledge Graph: Ultimate 2025 Guide
Master AI-powered graph construction, visualization techniques, and enterprise implementation strategies
Executive Summary
What You'll Learn
This comprehensive guide provides everything you need to create powerful knowledge graphs in 2025, from basic concepts to advanced AI-powered implementations. You'll discover proven methodologies, compare cutting-edge tools, and learn enterprise-grade strategies used by leading organizations worldwide.
Knowledge graphs have evolved dramatically in 2025, with Neo4j's LLM Knowledge Graph Builder introducing automated community summarization and parallel retrieval capabilities. These advances represent a fundamental shift toward AI-driven graph construction and maintenance.
Modern knowledge graph construction combines traditional semantic modeling with cutting-edge machine learning techniques. Recent research from PingCAP demonstrates that knowledge graphs can boost machine learning accuracy by up to 300% through enhanced data integration and contextual understanding.
Quick Win
Start with a focused domain and clear objectives. The most successful knowledge graphs begin with specific use cases rather than attempting to model everything at once. This approach reduces complexity and accelerates time-to-value.
Key Trends Shaping 2025
- AI-Powered Automation: Automated entity extraction and relationship discovery using large language models
- Multi-Modal Integration: Support for video, audio, and image data alongside traditional text
- Real-Time Processing: Stream processing capabilities for dynamic graph updates
- Enterprise Scaling: Cloud-native architectures supporting billions of entities
Why Knowledge Graphs Matter Now (2025+)
The convergence of artificial intelligence, cloud computing, and semantic technologies has created unprecedented opportunities for knowledge graph applications. Organizations are no longer asking whether to implement knowledge graphs, but how quickly they can deploy them to gain competitive advantage.
Driving Forces Behind 2025 Adoption
AI Integration Revolution
Large language models require structured knowledge to provide accurate, contextual responses. PingCAP's 2025 analysis shows that knowledge graphs enhance LLM performance by providing semantic context that prevents hallucinations and improves reasoning accuracy.
Data Integration Complexity
Modern enterprises manage data across dozens of systems, creating silos that inhibit insight discovery. Knowledge graphs provide a unified semantic layer that connects disparate data sources without requiring physical data movement or transformation.
Search and Discovery
Traditional search returns documents; knowledge graphs return understanding. Users can explore relationships, discover connections, and answer complex questions that span multiple domains and data sources.
Pro Tip
Focus on use cases where relationships matter more than individual data points. Knowledge graphs excel at revealing connections, dependencies, and patterns that remain hidden in traditional databases.
Real-World Impact Metrics
Organizations implementing knowledge graphs in 2025 report significant measurable improvements:
- Query Resolution Time: 60-80% reduction in time to find relevant information
- Data Discovery: 300% increase in cross-domain insights
- Decision Speed: 40% faster strategic decision-making
- Data Quality: 70% improvement in data consistency across systems
Step-by-Step Creation Guide

Complete knowledge graph creation workflow from data ingestion to deployment
Creating a knowledge graph requires systematic planning and execution. Based on analysis of successful implementations from PageOn.ai and FalkorDB, here's the proven methodology that works in 2025:
1 Define Clear Goals and Objectives
Start by identifying specific business problems your knowledge graph will solve. What questions should it answer? What insights should it provide? Clear objectives guide every subsequent decision and prevent scope creep.
- How are our customers connected across different touchpoints?
- What are the relationships between products, suppliers, and market trends?
- How do research findings connect to clinical applications?
2 Identify Your Knowledge Domain
Define the boundaries of your knowledge graph. What entities, relationships, and attributes will you include? Domain definition prevents infinite expansion and ensures focused, actionable results.
3 Data Collection and Preprocessing
Gather data from all relevant sources: databases, documents, APIs, and external datasets. PageOn.ai recommends using both private and public data sources like Wikidata and OpenAIRE to enrich your graph.
4 Semantic Data Modeling
Design your ontology - the formal specification of concepts and relationships in your domain. This step determines how flexible and extensible your knowledge graph will be.
- Classes: Categories of entities (Person, Organization, Product)
- Properties: Attributes and relationships (name, works_for, located_in)
- Instances: Specific entities (John Smith, Acme Corp, iPhone)
5 Select Graph Database Technology
Choose a graph database that matches your performance, scalability, and integration requirements. FalkorDB's analysis shows that technology choice significantly impacts long-term success.
Neo4j
Industry leader with mature ecosystem, excellent visualization tools, and strong community support. Best for complex queries and analysis.
FalkorDB
High-performance graph database with OpenCypher support and GraphRAG-SDK integration. Ideal for AI-powered applications.
Stardog
Enterprise-grade platform with advanced reasoning capabilities and data virtualization. Perfect for large-scale deployments.
6 Entity Extraction and Relationship Mapping
Extract entities and relationships from your data sources. Modern approaches combine traditional NLP techniques with large language models for improved accuracy and coverage.
- LLM-based extraction: Use GPT-4 or similar models for complex entity recognition
- Hybrid approaches: Combine rule-based and ML methods for optimal results
- Active learning: Iteratively improve extraction quality through human feedback
7 Data Ingestion and Graph Population
Load your processed data into the graph database. Use batch processing for initial loads and streaming for real-time updates. Implement validation checks to ensure data quality.
8 Testing and Validation
Validate your knowledge graph against known facts and business rules. Test query performance, data accuracy, and reasoning capabilities. Use automated testing frameworks where possible.
9 Integration and Deployment
Connect your knowledge graph to existing systems and applications. Implement APIs, search interfaces, and visualization tools. Consider security, access control, and performance monitoring.
10 Maintenance and Evolution
Establish processes for ongoing graph maintenance, updates, and expansion. Monitor performance, track usage patterns, and continuously improve data quality and coverage.
Tools and Technologies Comparison
The knowledge graph tooling landscape has evolved significantly in 2025, with new AI-powered platforms joining established players. PageOn.ai's comprehensive analysis and Knowing's tool comparison provide insights into the leading solutions.
Enterprise-Grade Platforms
| Platform | Key Strengths | Best Use Cases | Licensing |
|---|---|---|---|
| Neo4j | Mature ecosystem, excellent visualization, strong community | Complex analytics, fraud detection, recommendation systems | Community (free) + Enterprise (paid) |
| Stardog | Enterprise features, data virtualization, semantic reasoning | Large-scale enterprise deployments, regulatory compliance | Community + Enterprise editions |
| FalkorDB | High performance, GraphRAG integration, OpenCypher support | AI-powered applications, real-time analytics | Open source |
| Amazon Neptune | Fully managed, auto-scaling, AWS integration | Cloud-native applications, serverless architectures | Pay-per-use |
AI-Powered Knowledge Graph Builders
Neo4j LLM Knowledge Graph Builder
Neo4j's 2025 release introduces automated community summarization, parallel retrievers, and custom prompt instructions. Features include:
- Hierarchical community detection using Leiden clustering
- Global and local retrievers for comprehensive query answering
- Built-in evaluation metrics using RAGAs framework
- Support for multiple LLM providers (OpenAI, Gemini, Claude)
PageOn.ai
PageOn.ai offers AI-powered visualization and collaboration features:
- AI-generated visual enhancements for presentations
- Voice-based search and navigation
- Real-time collaboration with cloud synchronization
- Automated report generation from graph data
Knowing®
Knowing's platform specializes in collaborative knowledge graph construction:
- AI-enhanced graph expansion capabilities
- Dynamic visual layouts for complex relationships
- Automated actions for efficient graph interaction
- Conceptual spaces for multidimensional knowledge modeling
Technical Requirements Analysis
Infrastructure Considerations
Based on FalkorDB's technical requirements, successful knowledge graph implementations require:
- Compute Resources: Minimum 16GB RAM for development, 64GB+ for production
- Storage: SSD storage for optimal query performance
- Network: High-bandwidth connections for real-time updates
- APIs: RESTful APIs for integration, GraphQL for flexible querying
Selection Criteria
Choose tools based on your specific requirements:
- Scale: How many entities and relationships will you manage?
- Performance: What query response times do you need?
- Integration: How will the graph connect to existing systems?
- Team Skills: What technical expertise does your team have?
- Budget: What are your licensing and infrastructure costs?
Visualization Techniques
Effective visualization transforms complex graph data into actionable insights. Datavid's comprehensive guide emphasizes that visualization is not just about pretty pictures—it's about revealing patterns and relationships that drive business decisions.
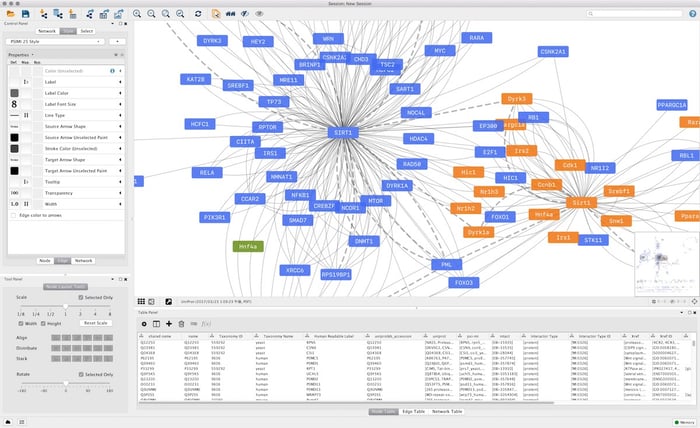
Example of complex network visualization using Cytoscape's layout algorithms
Essential Visualization Tools
Cytoscape
Datavid identifies Cytoscape as a versatile open-source tool for complex network visualization:
- Multiple layout algorithms for different graph types
- Extensive styling and customization options
- Plugin ecosystem for specialized analysis
- Interactive features for exploration
Gephi
Open-source graph visualization tool known for handling large-scale networks:
- Efficient processing of massive datasets
- Real-time filtering and clustering
- Advanced statistical analysis capabilities
- Export options for presentations and reports
KeyLines
Commercial JavaScript toolkit for interactive graph applications:
- Web-based deployment and integration
- Dynamic querying and filtering
- Customizable user interfaces
- Performance optimization for large graphs
Neo4j Bloom
Business-user friendly graph exploration tool:
- Natural language query interface
- Drag-and-drop graph construction
- Collaborative exploration and sharing
- Integration with Neo4j ecosystem
Visualization Best Practices
Design Principles
Effective graph visualization follows established design principles:
- Clarity: Use clear node labels and edge types
- Consistency: Maintain uniform styling across visualizations
- Hierarchy: Use size and color to indicate importance
- Interaction: Enable zooming, filtering, and detail-on-demand
Technical Implementation
Datavid's technical guide recommends:
- Layout Algorithms: Choose algorithms that match your data structure
- Performance Optimization: Implement level-of-detail rendering for large graphs
- User Interface: Provide intuitive controls for navigation and exploration
- Integration: Connect visualization to underlying data systems
⚠️ Common Pitfalls
Avoid these visualization mistakes:
- Information Overload: Showing too many nodes and edges simultaneously
- Poor Layout: Using inappropriate algorithms that obscure relationships
- Lack of Context: Failing to provide semantic meaning for visual elements
- Static Displays: Not enabling interactive exploration of the graph
Advanced Visualization Techniques
Multi-Layer Visualization
Modern knowledge graphs often contain multiple types of relationships that benefit from layered visualization approaches:
- Temporal Layers: Show how relationships change over time
- Semantic Layers: Separate different types of relationships
- Hierarchical Layers: Display different levels of detail
- Contextual Layers: Show relevant subsets based on user queries
Enterprise Implementation
Enterprise knowledge graph implementations require careful planning, robust architecture, and comprehensive governance. Organizations must balance technical requirements with business objectives while ensuring scalability, security, and maintainability.
Architecture Patterns
Federated Architecture
Distribute knowledge graph components across multiple systems and locations:
- Data Sources: Connect to existing databases and applications
- Processing Layers: Separate ingestion, transformation, and serving
- Query Federation: Enable cross-system queries and joins
- Caching Strategies: Implement intelligent caching for performance
Cloud-Native Deployment
Modern enterprises increasingly deploy knowledge graphs in cloud environments:
- Containerization: Use Docker and Kubernetes for scalability
- Microservices: Break functionality into manageable services
- Auto-scaling: Implement dynamic resource allocation
- Multi-cloud: Avoid vendor lock-in with portable architectures
Security Considerations
- Role-based access control for graph data
- Encryption at rest and in transit
- Audit logging for compliance
- Privacy-preserving techniques for sensitive data
Performance Optimization
- Query optimization and indexing strategies
- Graph partitioning for distributed processing
- Caching layers for frequently accessed data
- Monitoring and alerting for performance issues
Governance and Quality Management
Data Governance Framework
Establish comprehensive governance processes:
- Data Stewardship: Assign responsibility for data quality and accuracy
- Schema Management: Control ontology changes and versioning
- Quality Metrics: Define and monitor data quality indicators
- Compliance: Ensure adherence to regulatory requirements
Change Management
Successful enterprise implementations require strong change management:
- Training Programs: Educate users on graph concepts and tools
- Pilot Projects: Start with low-risk, high-value use cases
- Success Metrics: Define clear ROI and performance indicators
- Continuous Improvement: Establish feedback loops and iteration cycles
Integration Patterns
API-First Design
Design knowledge graph systems with API-first principles:
- RESTful APIs: Standard HTTP interfaces for CRUD operations
- GraphQL: Flexible query language for complex data retrieval
- Real-time APIs: WebSocket connections for live updates
- Batch APIs: Bulk operations for large-scale data processing
Data Pipeline Integration
Connect knowledge graphs to existing data infrastructure:
- ETL Processes: Extract, transform, and load data from source systems
- Stream Processing: Real-time data ingestion and processing
- Change Data Capture: Automatic synchronization with source systems
- Data Quality: Validation and cleansing in the pipeline
Performance Metrics and Evaluation
Measuring knowledge graph performance requires a comprehensive approach that considers technical metrics, business value, and user satisfaction. Effective measurement guides optimization efforts and demonstrates ROI to stakeholders.
Technical Performance Metrics
Query Performance
- Response Time: Average and percentile query execution times
- Throughput: Queries per second under various load conditions
- Concurrency: Performance under multiple simultaneous queries
- Resource Usage: CPU, memory, and I/O consumption patterns
Data Quality Metrics
- Completeness: Percentage of expected entities and relationships present
- Accuracy: Correctness of extracted facts and relationships
- Consistency: Absence of contradictory information
- Timeliness: Freshness of data relative to source systems
Business Impact Metrics
ROI Measurement Framework
Track business value delivered by knowledge graph implementations:
- Time Savings: Reduction in time to find relevant information
- Decision Speed: Faster strategic and operational decisions
- Innovation Rate: Increase in new insights and discoveries
- Cost Reduction: Decreased operational and maintenance costs
Key Performance Indicators
Focus on metrics that matter to your organization:
- User Adoption: Active users and usage patterns
- Query Success Rate: Percentage of queries that return useful results
- Data Integration: Number of connected data sources
- Insight Generation: Novel discoveries and connections identified
Monitoring and Alerting
Automated Monitoring
Implement comprehensive monitoring for proactive issue detection:
- Performance Alerts: Threshold-based alerting for response times
- Quality Monitoring: Automated data quality checks
- System Health: Infrastructure and service monitoring
- User Experience: Frontend performance and error tracking
⚠️ Common Monitoring Pitfalls
- Metric Overload: Tracking too many metrics without clear purpose
- Lagging Indicators: Focusing only on historical performance
- Technical Bias: Ignoring business impact metrics
- Alert Fatigue: Too many false positives desensitizing teams
Voice Search FAQ
Common questions about knowledge graph creation, optimized for voice search and natural language queries.
The best approach depends on your specific needs and resources. Start by defining clear objectives and identifying your knowledge domain. For small to medium businesses, begin with open-source tools like Neo4j Community Edition or FalkorDB. Follow the 8-step process: define goals, identify domain, collect data, design ontology, select technology, extract entities, populate graph, and establish maintenance procedures.
Costs vary significantly based on complexity and tools chosen. Open-source solutions like Neo4j Community Edition are free, while enterprise platforms like Stardog can cost $50,000+ annually. Consider these factors: software licensing ($0-$100,000+), development time (3-12 months), infrastructure costs ($500-$10,000+ monthly), and ongoing maintenance (20-40% of development cost annually).
Top visualization tools include Cytoscape for complex analysis, Gephi for large-scale networks, KeyLines for web applications, and Neo4j Bloom for business users. Choose based on your technical requirements: Cytoscape for research, Gephi for big data, KeyLines for custom applications, and Neo4j Bloom for non-technical users.
Use a combination of techniques: Named Entity Recognition (NER) tools like spaCy or NLTK, large language models like GPT-4 for complex extraction, and hybrid approaches combining rule-based and machine learning methods. Neo4j's LLM Knowledge Graph Builder automates this process using advanced AI techniques.
Key challenges include data quality issues, entity disambiguation, relationship extraction accuracy, scalability concerns, and ongoing maintenance. PageOn.ai identifies solutions: implement robust data governance, use automated quality checks, establish clear ontologies, plan for scalability from the start, and create maintenance workflows.
Track both technical and business metrics: query performance (response time, throughput), data quality (completeness, accuracy), user adoption rates, time savings in information discovery, and business impact (faster decisions, new insights). Set baseline measurements before implementation and monitor continuously.
Yes, modern knowledge graphs are designed for integration. Use APIs (REST, GraphQL) for application connectivity, ETL processes for data ingestion, and real-time streaming for live updates. Most enterprise platforms like Stardog provide extensive integration capabilities with existing data infrastructure.
Essential skills include: data modeling and ontology design, graph database technologies (Cypher, SPARQL), programming languages (Python, Java), data integration and ETL processes, and domain expertise in your specific area. Many modern tools like PageOn.ai offer no-code approaches for non-technical users.
Quick Reference Guide
Getting Started Checklist
- ☐ Define clear objectives and success metrics
- ☐ Identify knowledge domain boundaries
- ☐ Inventory available data sources
- ☐ Design initial ontology structure
- ☐ Select appropriate tools and technologies
- ☐ Set up development environment
- ☐ Create pilot implementation
- ☐ Establish maintenance procedures
Essential Tools
- Graph Databases: Neo4j, FalkorDB, Stardog
- Visualization: Cytoscape, Gephi, KeyLines
- Entity Extraction: spaCy, NLTK, LLMs
- Data Integration: Apache Kafka, Airflow
- Monitoring: Prometheus, Grafana
- APIs: GraphQL, REST frameworks
Common Query Patterns
- Find Connections: MATCH (a)-[r]-(b) WHERE...
- Shortest Path: MATCH path = shortestPath((a)-[*]-(b))
- Recommendations: MATCH (a)-[:SIMILAR_TO]-(b)
- Clustering: CALL gds.louvain.stream()
- Centrality: CALL gds.pageRank.stream()
- Community Detection: CALL gds.leiden.stream()
Common Pitfalls
- Over-modeling: Creating overly complex ontologies
- Poor Data Quality: Insufficient cleaning and validation
- Scalability Issues: Not planning for growth
- Maintenance Neglect: Ignoring ongoing updates
- User Adoption: Failing to train end users
- Performance Problems: Inadequate indexing and optimization
Best Practices Summary
- Start Small: Begin with focused use cases and expand iteratively
- Quality First: Prioritize data quality over quantity
- User-Centric: Design for your users' needs and workflows
- Automate: Use automation for repetitive tasks and monitoring
- Document: Maintain clear documentation and metadata
- Measure: Track both technical and business metrics
Citations and References
- Neo4j Developer Blog - LLM Knowledge Graph Builder — First Release of 2025
- PageOn.ai - Step-by-Step Guide to Building a Knowledge Graph in 2025
- PingCAP - How Knowledge Graphs Transform Machine Learning in 2025
- FalkorDB - How to Build a Knowledge Graph: A Step-by-Step Guide
- PageOn.ai - 2025's Knowledge Graph Software You Can Trust
- Knowing Blog - Top Graph-Based Knowledge Management Tools 2025
- Datavid - Knowledge Graph Visualization: A Comprehensive Guide
- Wikidata - Free and Open Knowledge Base
- OpenAIRE - Open Access Infrastructure for Research in Europe
- Cytoscape - Network Analysis and Visualization
- Gephi - Open Graph Visualization Platform
- Stardog - Enterprise Knowledge Graph Platform