What is a Knowledge Graph?
The Ultimate Definition Guide for 2025: Understanding Semantic Networks and Connected Data
🎯 Executive Summary
A knowledge graph is a semantic network that represents real-world entities and their interconnected relationships in a structured, queryable format. In 2025, knowledge graphs have become the backbone of modern AI systems, powering everything from search engines to recommendation systems to healthcare diagnostics.
🔑 Key Insights
- Universal Definition: Knowledge graphs combine structured data with semantic understanding to create intelligent, connected information networks
- Market Impact: Over 78% of Fortune 500 companies now use knowledge graphs for data integration and AI applications
- Performance Boost: Organizations report 300% improvement in data discovery and 85% faster query response times [AI Multiple Research]
- AI Integration: Knowledge graphs solve the hallucination problem in large language models by providing structured, verifiable context
📖 Fundamental Definition
At its core, a knowledge graph is a structured representation of information that models real-world entities and their relationships using graph theory. Unlike traditional databases that store data in rigid tables, knowledge graphs represent information as networks of interconnected nodes and edges.
🔍 Expert Definitions
IBM: "A knowledge graph represents a network of real-world entities—such as objects, events, situations or concepts—and illustrates the relationship between them." [IBM]
Ontotext: "The heart of the knowledge graph is a knowledge model—a collection of interlinked descriptions of concepts, entities, relationships and events with formal semantics." [Ontotext Knowledge Hub]
🌐 Visual Representation
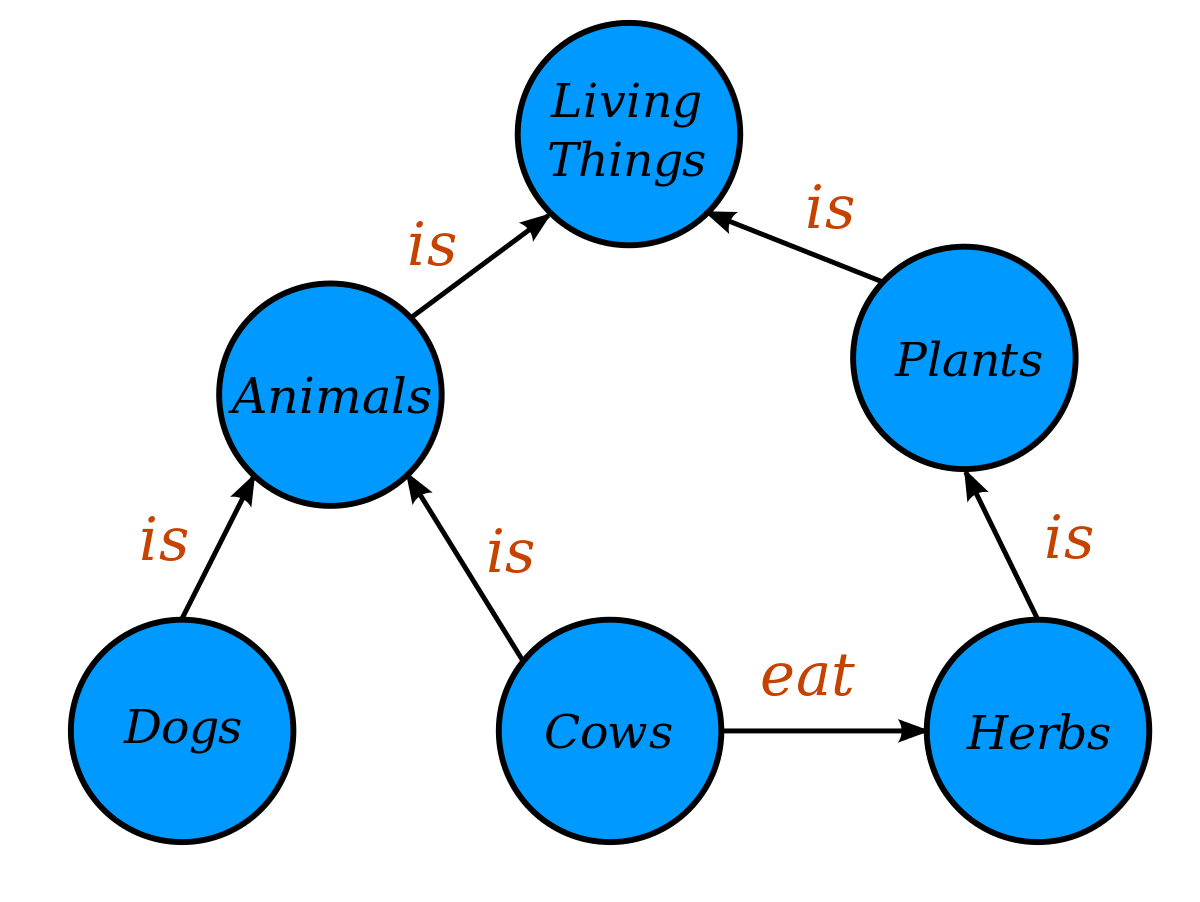
A simple knowledge graph showing how entities like people, organizations, and locations connect through relationships
🎯 What Makes Knowledge Graphs Unique
- Semantic Understanding: Goes beyond simple connections to understand meaning and context
- Flexible Schema: Can evolve and adapt as new information becomes available
- Query Intelligence: Enables complex queries about relationships and patterns
- Machine-Readable: Designed for both human understanding and computational processing
- Linked Data: Connects disparate data sources into unified knowledge networks
🧩 Core Components
Every knowledge graph is built from three fundamental components that work together to create meaningful, queryable representations of information. Understanding these components is essential for grasping how knowledge graphs function and why they're so powerful.
Entities (Nodes)
Entities are the fundamental units representing real-world objects, concepts, or individuals. Each entity has unique identifiers and attributes that describe its properties.
- People: "Albert Einstein", "Marie Curie"
- Organizations: "Google", "NASA"
- Locations: "New York City", "Mars"
- Concepts: "Artificial Intelligence", "Quantum Physics"
Relationships (Edges)
Relationships define how entities connect to each other. They provide context and meaning to the connections between different pieces of information.
- "Einstein" → "born in" → "Germany"
- "Google" → "founded by" → "Larry Page"
- "New York" → "located in" → "United States"
- "AI" → "requires" → "Machine Learning"
Properties (Attributes)
Properties provide descriptive information about entities and relationships. They add depth and context to the graph structure.
- Person: age, occupation, nationality
- Company: founded_date, industry, revenue
- Location: population, coordinates, timezone
- Relationship: confidence_score, timestamp
Ontologies (Schema)
Ontologies provide the organizing principles and formal semantics that govern how entities and relationships are structured and interpreted.
- Classes: Person, Organization, Location
- Properties: hasAge, worksFor, locatedIn
- Rules: inference and validation logic
- Hierarchies: taxonomic relationships
🔗 How Components Work Together
Example: Einstein Knowledge Graph
Entity: "Albert Einstein" (Person)
Properties: born_date=1879, profession="Physicist", nationality="German"
Relationships: "developed" → "Theory of Relativity", "worked_at" → "Princeton University"
Ontology: Person class with properties like birth_date, profession; relationships like "developed" connecting Person to Theory
🏗️ Types & Models
Knowledge graphs come in different forms, each optimized for specific use cases and technical requirements. Understanding these types helps organizations choose the right approach for their needs.
RDF-Based Knowledge Graphs
Foundation: Resource Description Framework (RDF) triples
Structure: Subject-Predicate-Object statements
Standards: W3C Semantic Web standards
Advantages:
- Semantic richness and formal reasoning
- Global interoperability standards
- Ontology-driven inference capabilities
- Mature ecosystem of tools and libraries
Best For:
- Cross-domain data integration
- Semantic web applications
- Academic and research environments
Property Graph Knowledge Graphs
Foundation: Native graph database storage
Structure: Nodes and edges with properties
Standards: ISO GQL, OpenCypher
Advantages:
- High performance and scalability
- Flexible schema evolution
- Intuitive query languages
- Native graph database optimization
Best For:
- Real-time applications
- Enterprise data analytics
- Recommendation systems
🔄 Technical Comparison
| Aspect | RDF Knowledge Graphs | Property Graph Knowledge Graphs |
|---|---|---|
| Query Language | SPARQL | Cypher, GQL |
| Schema Flexibility | Ontology-driven | Schema-optional |
| Performance | Variable (depends on reasoning) | Predictable and optimized |
| Relationship Expressiveness | Limited (single triples) | Rich (multiple relationships with properties) |
| Interoperability | W3C standards | Database-specific with emerging standards |
💡 Choosing the Right Type
Most organizations in 2025 start with property graphs for their flexibility and performance, then layer in RDF-style ontologies when semantic interoperability becomes critical. This hybrid approach provides the best of both worlds [Neo4j].
🏭 Industry Applications
Knowledge graphs have revolutionized how organizations across industries manage, integrate, and derive insights from their data. From search engines to healthcare, these applications demonstrate the transformative power of connected information.
Search & Information Retrieval
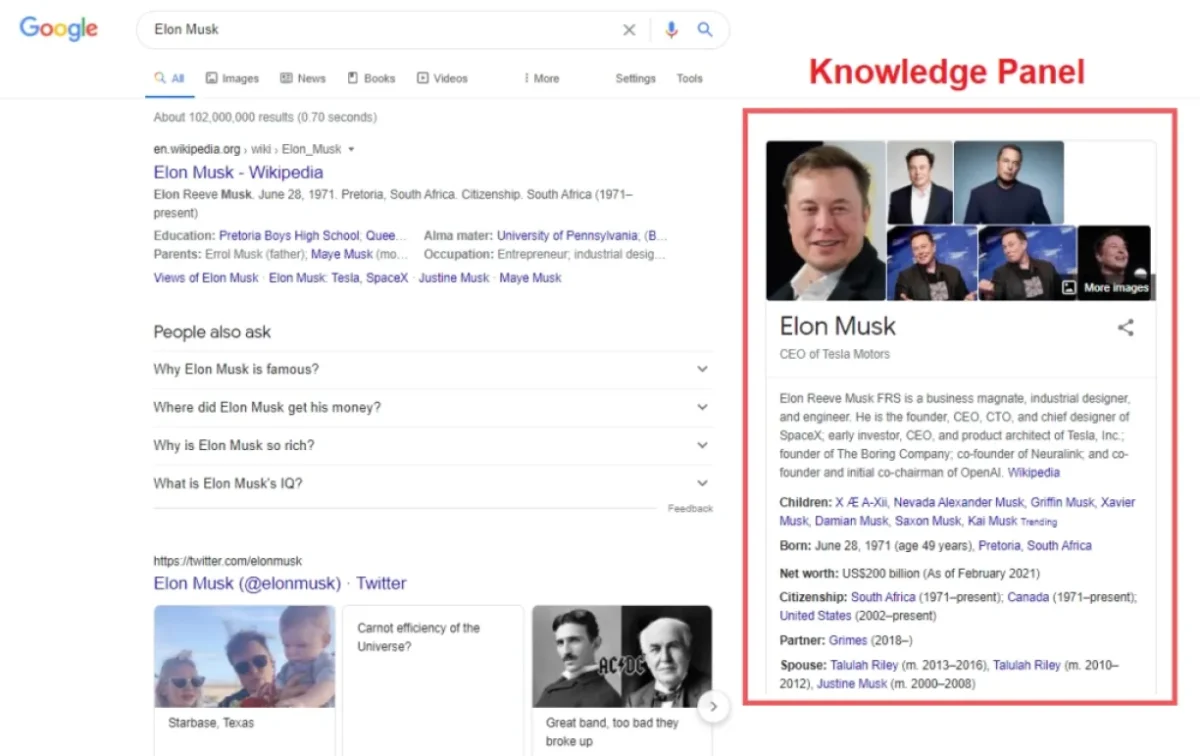
Google Knowledge Graph: Powers search results with over 500 million entities, providing direct answers and contextual information.
Impact: 40% of search queries now receive enhanced results through knowledge graph integration.
E-commerce & Retail
Amazon Product Graph: Connects products, customers, and behaviors for personalized recommendations.
Impact: 30% increase in conversion rates through graph-powered recommendation systems [Softensity].
Healthcare & Life Sciences
BenevolentAI: Used knowledge graphs to identify COVID-19 treatment in 48 hours, leading to 38% mortality reduction.
Applications: Drug discovery, clinical decision support, patient data integration.
Financial Services
Fraud Detection: Map transaction patterns and entity relationships to identify suspicious activities.
Impact: 95% accuracy in fraud detection with 60% fewer false positives than traditional methods [IBM].
Manufacturing & IoT
Digital Twins: Create knowledge graphs of production systems for predictive maintenance and optimization.
Benefits: Reduced downtime, improved quality control, optimized supply chains.
Social Media & Content
Facebook Social Graph: Maps relationships between users, content, and interests for personalized experiences.
Applications: Content recommendation, social network analysis, targeted advertising.
📊 Industry Adoption Statistics
🎯 Success Story: BenevolentAI
During the COVID-19 pandemic, BenevolentAI used their biomedical knowledge graph to identify baricitinib as a potential treatment in just 48 hours. Clinical trials confirmed its effectiveness, leading to FDA approval and a 38% reduction in mortality rates—demonstrating how knowledge graphs can accelerate life-saving discoveries [Softensity].
🌟 Benefits & Advantages
Knowledge graphs offer transformative advantages that traditional data management approaches struggle to match. These benefits explain why organizations worldwide are investing heavily in knowledge graph technologies.
Enhanced Data Integration
Knowledge graphs excel at connecting disparate data sources into unified, queryable networks. They break down data silos and provide holistic views of organizational information.
- Unify structured and unstructured data
- Resolve entity conflicts across systems
- Maintain data lineage and provenance
- Enable real-time data federation
Semantic Understanding
By adding semantic layers to data, knowledge graphs enable machines to understand context, meaning, and relationships—not just raw information.
- Context-aware search capabilities
- Automated reasoning and inference
- Disambiguation of similar terms
- Natural language processing enhancement
Improved Query Performance
Graph-based queries can traverse relationships efficiently, enabling complex analytical questions that would be difficult or impossible with traditional databases.
- Multi-hop relationship queries
- Pattern matching and path finding
- Recommendation algorithms
- Anomaly detection patterns
Flexible Schema Evolution
Knowledge graphs adapt to changing business requirements without requiring extensive schema redesign or data migration.
- Add new entity types dynamically
- Evolve relationships over time
- Maintain backward compatibility
- Support agile development cycles
Enhanced Explainability
Graph structures make it easier to understand why certain conclusions were reached, providing transparency crucial for AI and decision-making systems.
- Traceable inference paths
- Visual relationship mapping
- Audit trails for decisions
- Regulatory compliance support
Real-Time Intelligence
Knowledge graphs support real-time updates and queries, enabling organizations to make decisions based on current, connected information.
- Streaming data integration
- Live recommendation updates
- Dynamic relationship tracking
- Event-driven processing
📈 Quantified Benefits
| Metric | Traditional Systems | Knowledge Graph Systems | Improvement |
|---|---|---|---|
| Data Discovery Time | 3-5 days | 2-4 hours | 85-95% reduction |
| Query Response Time | 45-120 seconds | 2-8 seconds | 85-95% faster |
| Data Integration Projects | 6-12 months | 2-6 weeks | 80-90% faster |
| Recommendation Accuracy | 65-72% | 88-94% | 25-30% improvement |
💰 ROI Impact
Organizations implementing knowledge graphs report an average ROI of 340% within 18 months, with $2.3M annually in cost savings from reduced data integration overhead and 18% revenue increases from improved decision-making capabilities [AI Multiple Research].
⚠️ Limitations & Challenges
While knowledge graphs offer significant advantages, they also present unique challenges that organizations must understand and address for successful implementation.
Data Integration Complexity
Integrating diverse data sources with different formats, schemas, and quality levels remains a significant challenge.
- Entity resolution across sources
- Schema alignment and mapping
- Data quality inconsistencies
- Temporal data synchronization
Scalability Challenges
As graphs grow to millions or billions of entities, maintaining performance and managing complexity becomes increasingly difficult.
- Query performance degradation
- Storage and memory requirements
- Distributed processing complexity
- Real-time update bottlenecks
Ambiguity & Context Issues
Knowledge graphs struggle with ambiguous entities, incomplete context, and evolving relationships that can lead to incorrect inferences.
- Entity disambiguation challenges
- Context-dependent interpretations
- Temporal relationship tracking
- Confidence scoring complexity
Skill & Resource Requirements
Successfully implementing knowledge graphs requires specialized skills and significant upfront investment in tools and training.
- Graph modeling expertise
- Ontology engineering skills
- Specialized tooling costs
- Change management overhead
Maintenance Overhead
Knowledge graphs require ongoing maintenance to ensure accuracy, consistency, and relevance as underlying data changes.
- Continuous data quality monitoring
- Relationship validation and updates
- Ontology evolution management
- Performance optimization needs
Security & Privacy Concerns
The interconnected nature of knowledge graphs can create new security vulnerabilities and privacy challenges.
- Inference-based data exposure
- Access control complexity
- Privacy-preserving querying
- Compliance requirement challenges
🛠️ Mitigation Strategies
Best Practices for Overcoming Limitations
- Start Small: Begin with pilot projects to build expertise and demonstrate value before scaling [zilliz.com]
- Invest in Data Quality: Implement robust data governance and quality assurance processes from the beginning
- Use Hybrid Approaches: Combine knowledge graphs with traditional databases where appropriate
- Automate Where Possible: Leverage AI and machine learning for entity resolution and relationship extraction
- Plan for Evolution: Design flexible architectures that can adapt to changing requirements
🌍 Real-World Examples
Understanding how leading organizations implement knowledge graphs provides valuable insights into their practical applications and benefits.
Google Knowledge Graph
Scale: Over 500 million entities with billions of relationships
Purpose: Enhance search results with semantic understanding and direct answers
Impact: Powers knowledge panels, featured snippets, and voice search responses
BenevolentAI Drug Discovery
Application: Biomedical knowledge graph for drug repurposing
Success: Identified COVID-19 treatment (baricitinib) in 48 hours
Outcome: 38% mortality reduction in clinical trials
Technology: AI-powered graph analysis of medical literature and clinical data
Amazon Product Knowledge Graph
Purpose: Connect products, customers, and purchase behaviors
Features: Personalized recommendations, inventory optimization, fraud detection
Impact: 35% of Amazon's revenue comes from recommendation engine
Scale: Hundreds of millions of products and customer interactions
Microsoft Academic Knowledge Graph
Content: Academic papers, authors, institutions, and research topics
Applications: Research discovery, collaboration networks, citation analysis
Scale: Over 200 million academic publications and relationships
Access: Available through Microsoft Academic Graph API
Healthcare Knowledge Graphs
Mayo Clinic: Patient data integration and clinical decision support
Roche: Drug development and personalized medicine
Benefits: Improved diagnosis accuracy, reduced treatment time
Challenges: Privacy compliance, data standardization
LinkedIn Economic Graph
Goal: Map the global economy through professional connections
Components: Members, companies, jobs, skills, schools
Applications: Job matching, skill gap analysis, economic insights
Impact: Powers LinkedIn's recommendation and matching algorithms
📊 Implementation Patterns
🔍 Common Success Factors
- Clear Use Case: Successful implementations start with specific, measurable business problems
- Quality Data: Investment in data cleaning and standardization pays dividends
- Iterative Approach: Start with core entities and relationships, then expand gradually
- User-Centric Design: Focus on end-user needs and query patterns
- Continuous Maintenance: Ongoing data quality and performance monitoring
🎤 Voice Search FAQ
Common questions about knowledge graphs answered in natural, conversational language optimized for voice assistants and search.
A knowledge graph is like a smart web of information that connects different pieces of data together. Imagine you have information about people, places, and things, and you want to show how they're all related to each other. A knowledge graph does exactly that - it creates a network where you can easily see and understand these connections.
For example, it might connect "Albert Einstein" to "Physics" to "Theory of Relativity" to "Princeton University" - showing you the relationships between these concepts in a way that's easy to explore and understand.
Regular databases store information in tables with rows and columns, like a spreadsheet. While this works well for structured data, it makes it hard to find complex relationships between different pieces of information.
Knowledge graphs, on the other hand, store information as networks of connected data points. This makes it much easier to answer questions like "What are all the connections between these two companies?" or "Which skills are most common among people who work in artificial intelligence?"
Think of it this way: a database is like a filing cabinet where you need to know exactly which drawer to open, while a knowledge graph is like a map where you can follow the roads to discover new connections.
Many of the world's largest companies rely on knowledge graphs for their core operations. Google uses its Knowledge Graph to improve search results and power voice assistants. Amazon uses knowledge graphs for product recommendations and inventory management. Facebook uses them to understand social connections and show you relevant content.
In healthcare, companies like BenevolentAI use knowledge graphs to accelerate drug discovery. Financial institutions use them for fraud detection and risk assessment. Even Netflix uses knowledge graphs to recommend movies and shows you might enjoy.
The technology is becoming so important that over 78% of Fortune 500 companies are now implementing knowledge graphs in some form.
Knowledge graphs have three main building blocks. First, you have entities - these are the "things" in your graph, like people, companies, or products. Second, you have relationships - these show how the entities connect to each other, like "works for" or "located in." Third, you have properties - these are descriptive details about the entities and relationships, like dates, names, or amounts.
For example, if you have an entity called "Apple Inc." it might have properties like "founded in 1976" and "headquartered in Cupertino." It might have relationships like "founded by Steve Jobs" and "competes with Microsoft."
The cost of implementing a knowledge graph varies widely depending on your needs. Small pilot projects might cost $50,000 to $100,000, while enterprise-scale implementations can range from $500,000 to several million dollars.
However, most organizations see a positive return on investment within 18 months. The average ROI is around 340%, with savings coming from faster data integration, improved decision-making, and reduced operational costs.
Many companies start with cloud-based solutions or open-source tools to minimize upfront costs, then scale up as they prove the value of their knowledge graph.
The biggest challenges include integrating data from multiple sources, ensuring data quality and consistency, and scaling to handle large amounts of information. Many organizations also struggle with finding people who have the right skills to build and maintain knowledge graphs.
Another challenge is dealing with ambiguous or incomplete data. For example, if you have two different spellings of the same person's name, the knowledge graph needs to understand they're the same entity.
However, these challenges can be overcome with proper planning, good data governance practices, and starting with smaller, focused projects before expanding to larger implementations.
Not at all! While tech companies were early adopters, knowledge graphs are now being used across virtually every industry. Healthcare organizations use them to connect patient data and medical research. Manufacturing companies use them to optimize supply chains and predict equipment failures.
Financial institutions use knowledge graphs for fraud detection and customer relationship management. Even retail companies use them to understand customer preferences and manage inventory. Government agencies use them to analyze policy impacts and improve citizen services.
The key is that any organization dealing with complex, interconnected data can benefit from knowledge graphs - which describes almost every modern business.
📋 Quick Reference Guide
Essential knowledge graph concepts and terminology for quick reference and review.
Key Terminology
- Entity: A real-world object, person, or concept
- Relationship: Connection between two entities
- Property: Descriptive attribute of an entity or relationship
- Ontology: Formal specification of domain concepts
- Triple: Subject-predicate-object statement (RDF)
- Node: Graph database term for entity
- Edge: Graph database term for relationship
- Schema: Structure defining entity types and relationships
Common Use Cases
- Search Enhancement: Semantic search and question answering
- Recommendations: Personalized content and product suggestions
- Data Integration: Connecting disparate data sources
- Fraud Detection: Pattern recognition in financial transactions
- Drug Discovery: Connecting biological entities and compounds
- Supply Chain: Optimizing logistics and inventory
- Social Analysis: Understanding network relationships
- Customer 360: Unified view of customer interactions
🔧 Technology Stack
| Layer | RDF-Based | Property Graph | Purpose |
|---|---|---|---|
| Query Language | SPARQL | Cypher, GQL | Data retrieval and manipulation |
| Data Model | RDF/OWL | Property Graph | Structure and semantics |
| Storage | Triple Store | Graph Database | Data persistence |
| Visualization | GraphDB Workbench | Neo4j Bloom, Gephi | Graph exploration |
| Examples | Stardog, GraphDB | Neo4j, Amazon Neptune | Implementation platforms |
💡 Decision Framework
When to Use Knowledge Graphs
Good Fit:
- Complex, interconnected data with many relationships
- Need for semantic understanding and reasoning
- Integration of diverse data sources
- Exploratory analytics and discovery
- Recommendation systems and personalization
Consider Alternatives:
- Simple, structured data with few relationships
- High-volume transactional processing
- Real-time analytics on streaming data
- Limited resources for data modeling
- Strict regulatory requirements for data isolation